Rethinking nitrogen in the high-rainfall zone
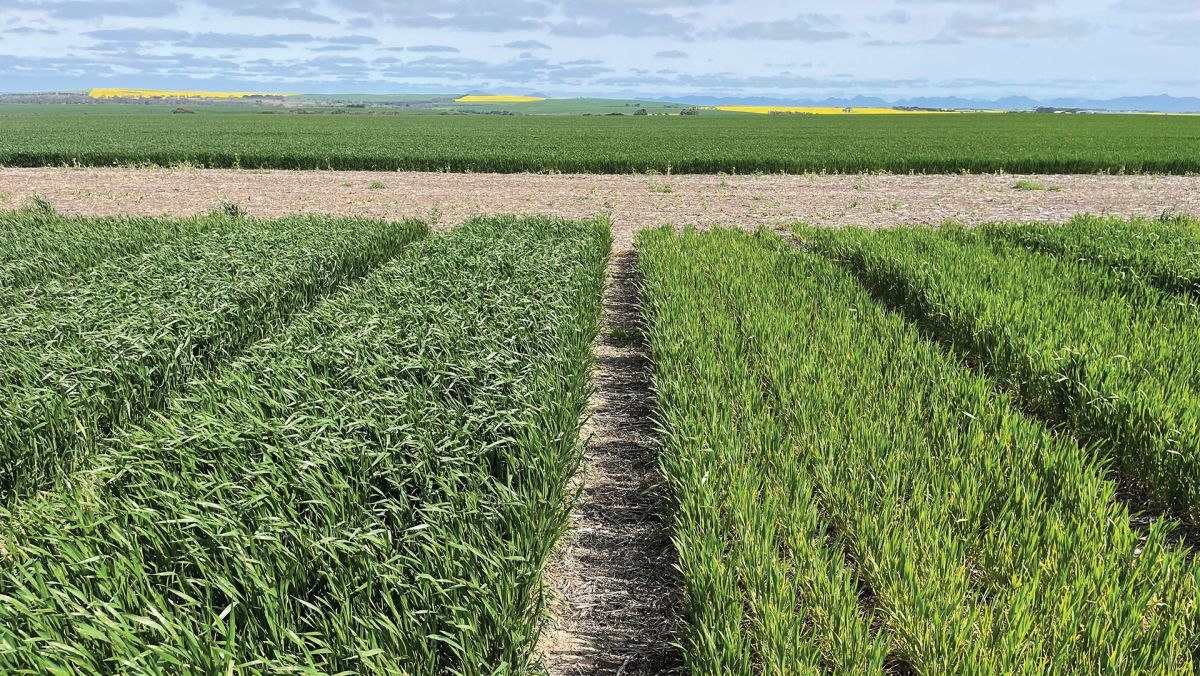
Yield curve wheat trial plots at Willaura in September 2024. Left – 320 kg/ha of nitrogen. Right – 0 kg/ha of nitrogen. Photos: supplied
New data is backing up research that starting soil nitrogen, total applied nitrogen and seasonal conditions often matter more for profitability than fertiliser product choice or the number of split applications.
It also reinforced the message that chasing maximum yield does not always deliver the best return.
The research stemmed from a GRDC National Grower Network forum at Tatyoon, Victoria, in 2022, when high fertiliser prices triggered by the Ukraine-Russia conflict had growers questioning whether they were getting the best return from their nitrogen.
Southern Farming Systems (SFS) responded with a GRDC-invested project focused on improving returns from fertiliser nitrogen in Victoria’s high-rainfall zone (HRZ). The project combined field trials with workshops covering soil nitrogen, precision agriculture and decision-making when prices and seasons are uncertain.
Project lead Greta Duff, SFS Research and Extension Cropping Coordinator, says growers wanted more than rules of thumb.
They were asking “the why questions”, she says – how soil type, mineralisation, product and timing interacted, and whether mineralisation was being underestimated.
What the trials tested
Ms Duff says 2 sets of trials, representing lower and moderate to higher starting soil nitrogen levels, were established in 2024 at Willaura and Streatham in south-west Victoria.
The research had 2 main components:
- nitrogen yield curves in wheat and canola, with 0 to 320 kg N/ha in 40 kg increments, split across 3 applications so that rate – not timing – was the variable
- product and timing trials, comparing standard urea, the urease inhibitor and liquid nitrogen with the same total nitrogen (200 kg N/ha in wheat, 230 kg N/ha in canola) applied in different patterns.
All plots received monoammonium phosphate (MAP) at sowing and were managed with standard HRZ agronomy.
Deep soil tests (0 to 90 cm) before sowing and after harvest measured starting nitrogen and residual nitrogen, helping calculate nitrogen use efficiency and capture mineralisation and carryover.
Both 2024 and 2025 were unusually dry for the region, with significant frost events in 2024 and some frost and moisture stress in 2025.
At Streatham in 2024, wheat was hit by a run of late frosts during flowering, with temperatures dropping to minus 2.8° C and 7 consecutive days below 3° C, alongside a dry spring and growing season rainfall of almost 260 mm.
Ms Duff says these were “tricky seasons”, with severe frost at Streatham in 2024 and haying off in one of the 2025 nitrogen yield curve trials.
What the yield curves show
Despite the seasonal conditions, wheat at Willaura – where starting soil nitrogen at 0 to 90 cm was relatively low – followed a typical nitrogen response curve.
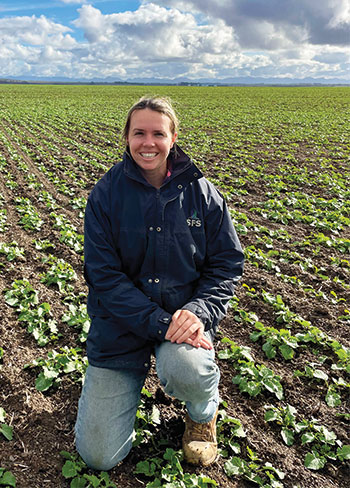
Southern
Farming Systems Research and Extension Cropping Coordinator Greta Duff
in a plot of canola at Willaura in June 2025. Photo: supplied
Yield climbed from about 4.3 t/ha with no fertiliser nitrogen to a peak of about 5.8 t/ha at 200 kg N/ha, then plateaued or declined at higher rates.
Grain protein also increased with nitrogen rate, passing 11% once nitrogen was no longer a limiting factor.
Ms Duff says results were similar in both wheat and canola at Willaura in 2025, with typical yield curves and diminishing returns beyond an economic optimum.
By contrast, at Streatham – where pre-sowing soil tests showed 60 to 77% higher residual nitrogen at 0 to 90 cm – wheat yield was largely unresponsive to extra in-season nitrogen, although grain protein climbed as nitrogen rates increased.
Canola at Streatham did respond to nitrogen, but maximum yields were achieved at modest rates of about 80 kg N/ha applied, with little benefit from higher rates.
Those contrasting responses support one of the project’s core messages: when starting soil nitrogen is lower, crops show the expected response curve and with diminishing returns as nitrogen is added, but with higher starting soil nitrogen, responses can be flat or erratic when seasonal stressors intervene.
What really mattered: timing
The product and timing trials compared 3 nitrogen sources – standard urea, the urease inhibitor (Green Urea NV®) and liquid nitrogen – across different split application strategies.
In 2024 at Streatham, neither the number of applications nor the nitrogen product had a statistically significant effect on wheat or canola yield or quality in a year when frost and a dry finish capped production and grain protein levels suggested nitrogen was not limiting.
Even so, some trends emerged. Plots treated with Green Urea NV® tended to retain more nitrogen in the soil profile after harvest, consistent with the urease inhibitor slowing conversion to ammonia and reducing volatilisation losses.
Liquid nitrogen, applied as foliar or near surface applications, appeared to be used more immediately by the crop, with slightly lower residual nitrogen and slightly higher yields in some comparisons, although differences were not significant.
“We saw that timing had more of an influence than the product used,” Ms Duff says.
SFS General Manager Ashley Amourgis, who presented on the trials at the GRDC Research Update in Bendigo, says establishing a nitrogen baseline is critical and matching applications to crop demand remains key.
Know your starting point
Across all trials, the strongest and most consistent message for growers was the value of deep soil testing.
“Doing your deep soil nitrogen tests is really important to help guide your decisions for in-season nitrogen applications,” Ms Duff says
The team is also keen to challenge some longstanding assumptions about mineralisation in the HRZ.
Ms Amourgis says mineralisation contributes more nitrogen than many think, and some common rules of thumb may not fit HRZ conditions.
Ms Duff says growers use mineralisation in nitrogen budgets in very different ways – some explicitly factor in a mineralisation estimate, while others ignore it and base decisions purely on fertiliser nitrogen – which can lead to overshooting or undershooting nitrogen targets.
She warns that relying too heavily on mineralisation without measuring soil nitrogen risks “mining too much” of the soil reserve over time, especially in high-yielding systems.
Revisiting yield targets
In canola, one of the yield curve trials showed applying 80 kg N/ha produced the same yield as 160 kg N/ha (when residual N before sowing is high), effectively halving the fertiliser bill for no loss in production.
That result, together with flat response curves at higher starting nitrogen sites, has sharpened the economic lens on nitrogen strategies.
Ms Duff says one key message from the project is that “chasing the highest yield is not necessarily going to net you the best economic return”.
In seasons of high fertiliser prices and uncertain grain prices, she suggests some growers might be better off prioritising profitability by targeting a lower yield.
She also encourages growers to judge their nitrogen decisions by the process they use – soil testing, budgeting, consideration of price and risk – not by whether they are ultimately rewarded or punished by the season.
How far to extrapolate?
Given the dry conditions and frost events in 2024 and 2025, Ms Duff is cautious about extending these results across other parts of the HRZ.
While 2025 yield curves at Willaura and Streatham appeared similar to 2024, with either classic responses at lower starting nitrogen or minimal yield response where nitrogen was already high, she says abnormalities at Streatham – “either no response or not what we expect” – were most likely due to frost in 2024 and moisture stress in 2025.
Her view is that in other HRZ environments, especially during more typical wetter years or under waterlogging, response curves and product differences may play out in other ways. That is one reason SFS has secured an extra year of funding to repeat the yield curves at the same sites, run 2 more workshops, and to build a multi-year dataset.
“People are saying this year is a bit similar to what they saw in 2015,” Ms Duff says. “Eventually we’ll be able to provide a bit of guidance for the future that growers can refer back to.”
This article was published in GroundCover
